Working with XSDB
Xilinx® System Debugger (XSDB) uses the Xilinx hw_server as the underlying debug engine. SDK translates each user interface action into a sequence of TCF commands. It then processes the output from system Debugger to display the current state of the program being debugged. It communicates to the processor on the hardware using Xilinx hw_server.
The debug workflow is described in the following diagram:
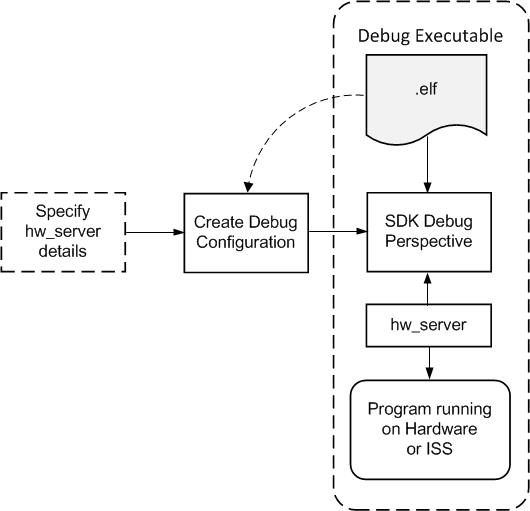
The workflow is made up of the following components:
- Executable ELF File: To debug your application, you must use an Executable and Linkable Format (ELF) file compiled for debugging. The debug ELF file contains additional debug information for the debugger to make direct associations between the source code and the binaries generated from that original source. Refer to Build Configurations for more information.
- Debug Configuration: In order to launch the debug session, you must create a debug configuration in SDK. This configuration captures options required to start a debug session, including the executable name, processor target to debug, and other information. Refer to Launch Configurations for more information.
- SDK Debug Perspective: Using the Debug perspective, you can manage the debugging or running of a program in the Workbench. You can control the execution of your program by setting breakpoints, suspending launched programs, stepping through your code, and examining the contents of variables.
You can repeat the cycle of modifying the code, building the executable, and debugging the program in SDK.
Note: If you edit the source after compiling, the line numbering will be out of step because the debug information is tied directly to the source. Similarly, debugging optimized binaries can also cause unexpected jumps in the execution trace.